Monitoring Weather with Prefect ETL
The automated process known as ETL (Extract, Transform, Load) takes raw data, extracts the information needed for analysis, converts it into a format that may meet business demands, and loads it into a data warehouse. To decrease the quantity of the data and increase efficiency for particular types of analysis, ETL often summarises the data.
Data from many sources must first be integrated before you can construct an ETL system. Then, to make sure you transform the data appropriately, you must carefully prepare and test. This procedure is time-consuming and difficult.
Here is a flow showcasing the ETL that we will be creating today with Prefect.

Source data
The source for the ETL pipeline is the OpenWeather API. OpenWeather API helps in fetching weather forecasts, nowcasts and historical information.
It offers a special `One call API` which returns complete weather dataset with
- 1 hour data by each minute
- 48 hours hourly forecasts
- Daily forecasts for 8 days
Today, we will be processing the data produced by OpenWeatherAPI and process just the current attributes/metrics from the API response.
Destination
The sink node for the ETL pipeline will be elasticsearch deployed on cloud. We will use Kibana to create dashboards and visualise the current weather information.
Working Example
Firstly, we will start with registering for API keys and create a cloud elasticsearch deployment.
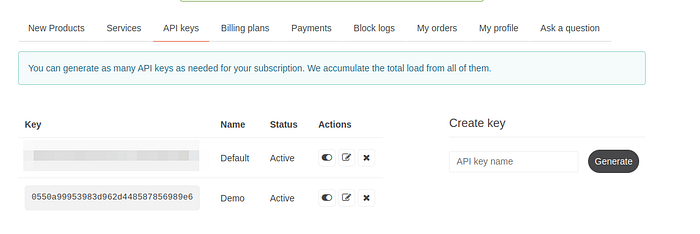
You can signup for OpenWeatherAPI and generate your API access token.

This API key will help us to fetch/poll the data at whatever frequency fits suitable to our usecase. In this tutorial, we will fetch data every 5 minutes and push data with same frequency to cloud elasticsearch deployment.
Elasticsearch offers 14 day free trial period . We will see how we can connect our ETL pipeline with the managed cluster deployed in just under 3 minutes with Elastic Cloud.
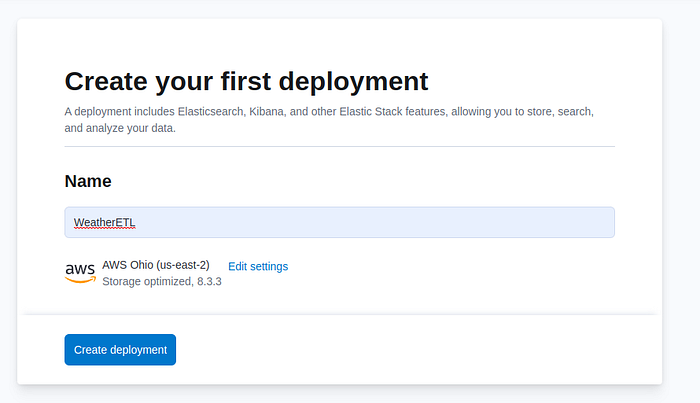
Follow the default configuration offered by Elastic cloud for elasticsearch and Kibana deployment.


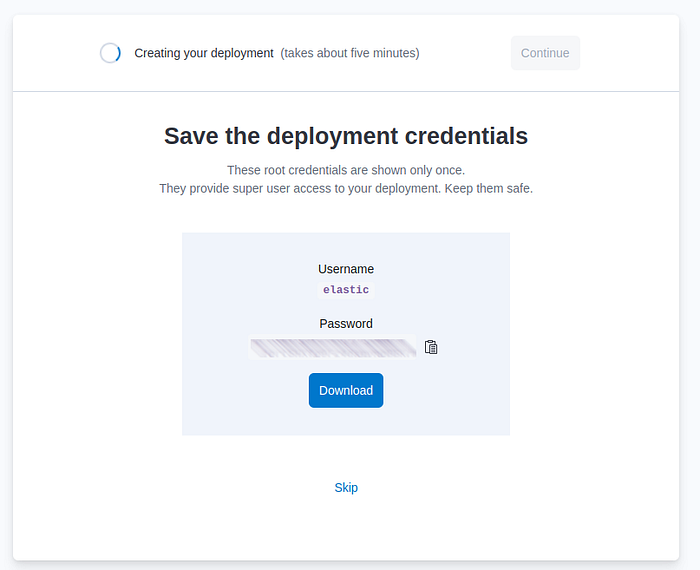
It can take few minutes to deploy elasticsearch. Once its done, you would be able to see a screen as below.

The managed cloud deployment generates a Cloud ID that can be used to connect to the elasticsearch cluster directly from our ETL.
We need to note down the Cloud ID for our elasticsearch deployment.
You can manage the cloud deployment and clusters, instance within this dashboard.
Let’s start with writing an ETL pipeline with Prefect
You can download and get started with the instructions mentioned in the README file for this Github repository.
Once the virtual environment is setup with the required packages, we can start with writing some code in our main.py file.
Comments in the code are pretty straightforward to show what we are trying to achieve.
I created another file config.py which contains the configuration for the main.py file.
# password to connect to the cloud elasticsearch deployment
ELASTIC_PASSWORD = "FK6V3wYgSikVSP2uPiEXm1Bl"# Cloud deployment ID
CLOUD_ID = "WeatherETL" \          ":dXMtY2VudHJhbDEuZ2NwLmNsb3VkLmVzLmlvOjQ0MyQ3MDBmNGQ1NWEyODE0OGFmYjdmNzkwMDFlZTYxNzk5NSRjMjc2ODgxODQ2ODQ0MzU3OTc4OWY0Nzc1NWNiNTIwMg== "# API Key generated from OpenWeatherAPI_KEY = "0550a99953983d962d448587856989e6"
Now, we can run our main.py as a python script with
nohup python3 main.pySince, we need to run our ETL pipeline without any interruptions we can use nohup and the output of the ETL pipeline will be saved to nohup.out file in the same folder.
Our ETL will start fetching data from OpenWeather API every 5 minutes and push them at the same time to elasticsearch without any delay.
I deployed the project on a EC2 machine on AWS with a t2.micro instance, without any issues and incurring any costs.
Creating Dashboards on Kibana
Kibana offers a UI to investigate, build dashboards and visualisation on elasticsearch deployment.
With the Elasticsearch cloud deployment, Kibana is also deployed.
Here is a sample dashboard that you can create in Kibana.

This dashboard consists of the metrics fetched across the days I ran my script.
We can create data tables, metrics, bar charts, line charts and many more visualisations with Kibana. These are just a few basic samples.
This was just an example of how easy it is to create ETL with Prefect.
Prefect is a powerful tool to build, run and automate pipelines at scale.
A scalable view for this ETL would be to create multiple threads sharing fetching data for multiple locations. This would how the first part of the flow would look like where each arrow represents parallel calls from the ETL with different latitude and longitude.

Final Thoughts
This concludes the basic ETL design with Prefect.
Please see the official manual for more in-depth instructions on setting up logging and Slack alerts, among other things. The examples shown is more than sufficient to get you going.
